
StarCraft Pro Scout - Supervised Classification
eSports has become big business over the past couple of decades. Going from small Quake LAN tournaments in someone’s basement to arena events with thousands of spectators, streamed to tens of millions of viewers, with multi-million dollar prizes to be won. StarCraft is the original eSport and continues to be popular, generating over $37 million in winnings for its pro players.
What if you could predict who the next big eSports player would be? StarCraft’s competitive online multiplayer has a league system and players move up and down the 8 leagues depending on their wins and losses in online games with other players. Far from being just a cool way to show how many opponents you’ve beaten, the StarCraft League system is where the best players compete for dominance to show their prowess and readiness to join the StarCraft tournament circuit. At the top tiers of the Leagues membership is limited with the top percentage of players in a particular League being promoted up and the lower percentage being demoted down. The fierceness of the competition and caliber of players playing in the Leagues makes it a good gauge of who will do well in tournaments and win.
Using classification and supervised learning techniques the goal of this project is to create a model to predict the StarCraft League of a player through various objective measures of skill and ability. These variables that quantify skill were obtained from a dataset from a 2013 cognitive science study from Simon Fraser University, where they analyzed almost 3400 game replays of players in the League system.
An effective model for classifying players into Leagues based on their technical execution skills can allow eSports teams to scout promising pro players early to bolster the roster of their teams and increase revenue by winning tournaments.
Visit the Github repo to see the data, code and notebooks used in the project.
Assumptions
- We will assume that the variables from the dataset are wide and varied enough to be able to determine both a player’s skill and where they are placed in the StarCraft 2 Leagues system. Using my domain knowledge of StarCraft when I look at the variables being measured they seemed like they will be very good and could have some interesting surprises.
- We also assume that where a player is in the League system is a good gauge of their professional eSports potential. Because StarCraft 2 pro players actively participate in the League system and top players in that system are very successful at tournaments this should be a pretty safe assumption.
- It’s always important to note that these assumptions may not pan out and the results of the models will likely reveal how useful and informative the sample and variables are to creating an effective model.
Methodology
- A dataset from a 2013 cognitive science study from Simon Fraser University called StarCraft2 Replay Analysis, which measured players’ technical skills in the game, is the data source for the project. The variables from this dataset are used to attempt to create a model that will classify a player into their presumed StarCraft League.
- Both parametric and non-parametric classification techniques such as KNN, Support Vector Classifiers, Random Forests and Logistic Regression are used for the modeling process.
Data
- The StarCraft2 Replay Analysis dataset has almost 3400 observations and 20 variables which generally quantify a player’s skill with the game by measuring various technical execution abilities. These range from how quickly a player can input commands, to the types and variety of units they create, to how quickly they respond to changing situations on the battlefield.
- Each of the observations is one game from a unique individual player, so these are observations of roughly 3400 players. A very small number of entries that were from the same players got in to the dataset and were removed.
- Notes
- “PAC” is an acronym for Perception Action Cycle which, in the context of StarCraft, measures when a player takes an action after changing camera position. This evaluates how quickly, in general, a player responds to changing gameplay situations, though not how effective those actions are.
- There are are roughly 88.5 timestamps per real-time second.
- Link to additional info on the StarCraft 2 League System.
- Target - Player League Rank
- Variables
- GameID: Unique ID for each game (integer)
- LeagueIndex: 1-8 for Bronze, Silver, Gold, Platinum, Diamond, Master, GrandMaster, Professional League (ordinal)
- Age: Age of each player (integer)
- HoursPerWeek: Hours spent playing per week (integer)
- TotalHours: Total hours spent playing (integer)
- APM: Action per minute (continuous)
- SelectByHotkeys: Number of unit selections made using hotkeys per timestamp (continuous)
- AssignToHotkeys: Number of units assigned to hotkeys per timestamp (continuous)
- UniqueHotkeys: Number of unique hotkeys used per timestamp (continuous)
- MinimapAttacks: Number of attack actions on minimap per timestamp (continuous)
- MinimapRightClicks: Number of right-clicks on minimap per timestamp (continuous)
- NumberOfPACs: Number of PACs per timestamp (continuous)
- GapBetweenPACs: Mean duration (milliseconds) between PACs (continuous)
- ActionLatency: Mean latency (milliseconds) from the onset of PACs to their first action (continuous)
- ActionsInPAC: Mean number of actions within each PAC (continuous)
- TotalMapExplored: Number of 24x24 game coordinate grids viewed by player per timestamp (continuous)
- WorkersMade: Number of SCVs, drones, probes trained per timestamp (continuous)
- UniqueUnitsMade: Unique units made per timestamp (continuous)
- ComplexUnitsMade: Number of complex units (ghosts, infestors, and high templars, etc.) trained per timestamp (continuous)
- ComplexAbilityUsed: Abilities requiring specific targeting instructions used per timestamp (continuous)
- MaxTimeStamp: Time stamp of game’s last recorded event (integer)
- Data Files
- Source Data File: StarCraft2ReplayAnalysis.csv
- Data Documentation: StarCraft2ReplayAnalysisDocumentation-1.pdf
1. Tools
- Python
- Jupyter Notebooks
- Pandas
- Numpy
- Seaborn
- Matplotlib
- Scikit-learn
- StatsModels
- Patsy
2. Data Cleaning
- Source File: scpro_data_clean.ipynb
General data cleaning consisted of removing duplicate entires, dropping the GameID column, dealing with significant outliers, and dealing with NaN values.
Every observation was supposed to be from a unique player, but a few were from the same players. The researchers identified these specific entries, of which there were about 10, and left it to the users of the dataset to decide whether or not to use them. Because there were so few I decided to just take them out.
Deciding what to do with outliers actually took quite a bit of time as they turned out to be a bit more varied than they initially seemed. The most egregious outliers were in the total hours played. There was one entry with a ridiculous total of 100k hours which is most likely erroneous, but in any case it was only one entry and not something we wanted to keep. There seemed to be some more natural extreme outliers though, well beyond the 1.5xIQR standard, but I didn’t want to eliminate them all, since they seemed to be a natural part of the data set. I eliminated those that were 3xIQR and kept the rest.
NaNs were a bit more troublesome. After investigating it turned out that they were limited to only about 56 observations, but they all came from the highest League players, League 8 (Pro). There were no entries for Age, TotalHours or HoursPerWeek for any of these players. I was very interested in these variables as factors in performance so I didn’t want to drop these columns. I also didn’t want to simply eliminate these observations, as that would remove all of the Pro players, effectively removing 1 of the 8 League, and arguably the League of greatest interest, the Pro league.
Ultimately, since I didn’t have any data on Pro players for these features there was not an effective way to infer what the numbers would be through normal techniques like taking the mean or doing a regression, so I made the tough decision to just remove these features (Age, TotalHours, HoursPerWeek) from the dataset.
3. Feature Selection
- Source File: scpro_eda.ipynb
- Source File: scpro_data_clean.ipynb
Testing Normality
Some interesting and challenging insights about the variable data led to some additional tough choices about which features to keep and which to remove. Overall, there were two issues with the data. One, most variables were not normally distributed and two, there was pretty significant collinearity between a number of variables.
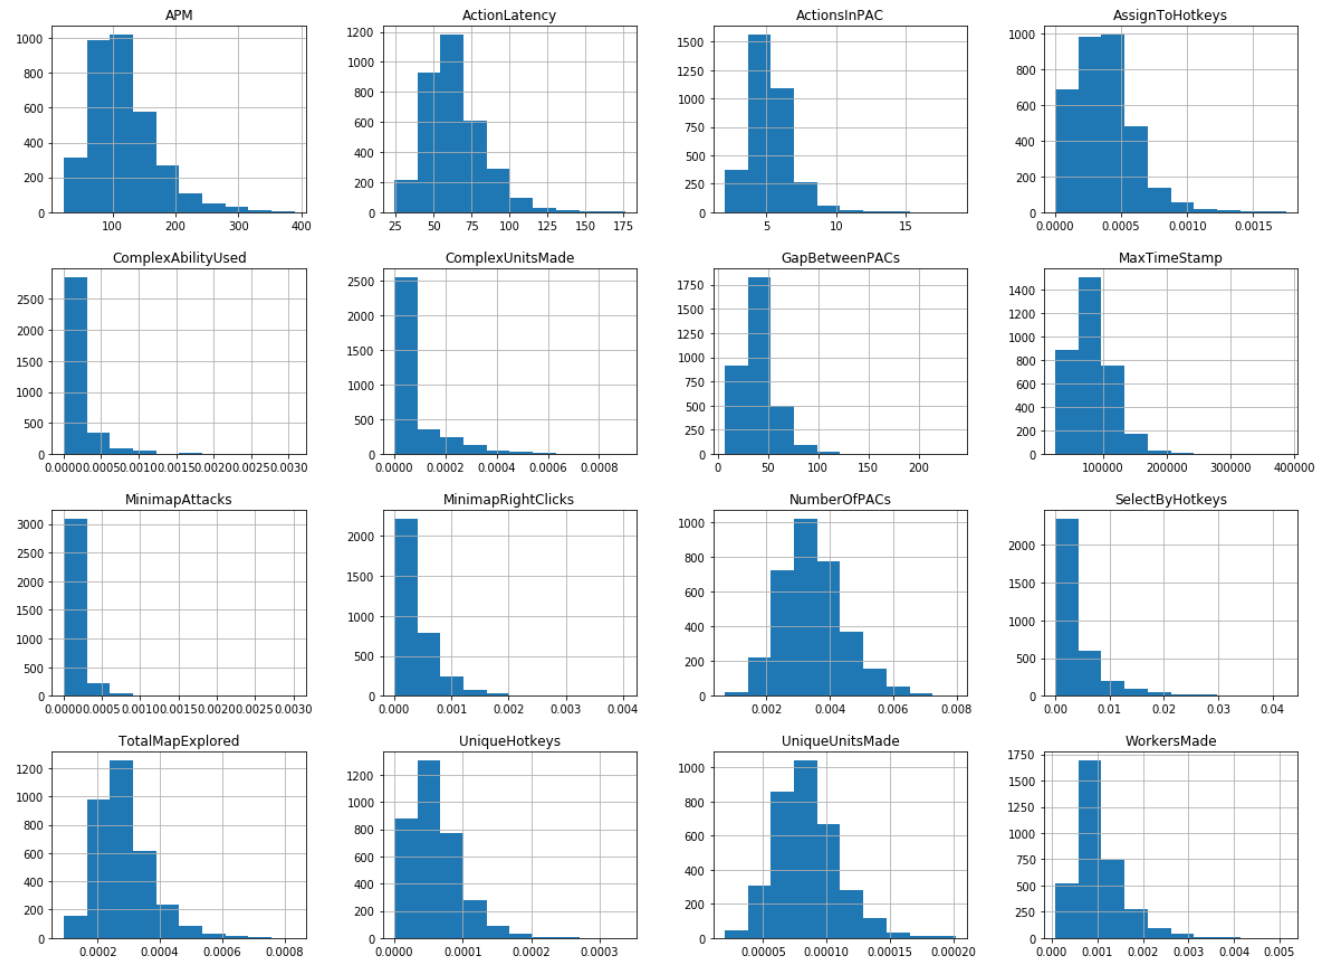
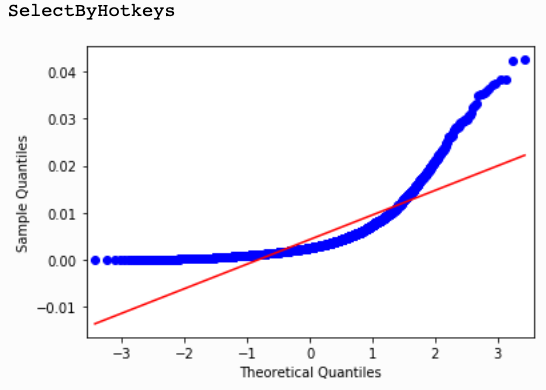
Because most parametric methods depend on normally distributed data I went to great lengths to investigate the distribution of all of the variables. I employed several methods for testing for normality, starting with graphical representations with histograms and Q-Q plots, then moving on to more rigorous quantitative measures, using Shapiro-Wilk, D’Agostino and Anderson-Darling normality tests. Many of the variables just had a natural skew to them and mostly a right skew. This actually makes sense as the Leagues encompass a wide spectrum of players, from the casual players who might play a competitive game every once in a while to Pro gamers for whom StarCraft is their job and they win hundreds of thousands of dollars by winning worldwide tournaments.
 im
im
Power Transformations
After seeing these results the next step was to try power transformations to see if we could achieve more normal distributions with the data. The standard methods of taking the log, squaring and taking square root didn’t improve normality, nor did the Box-Cox transformation. However, the Yeo-Johnson power transform worked comparatively well, allowing the most variables to pass the quantitative normality tests. However, this still left only 5 of the 19 variables. For parametric models, I would only have a very small selection of potential features to choose from.
![]()
Multicollinearity
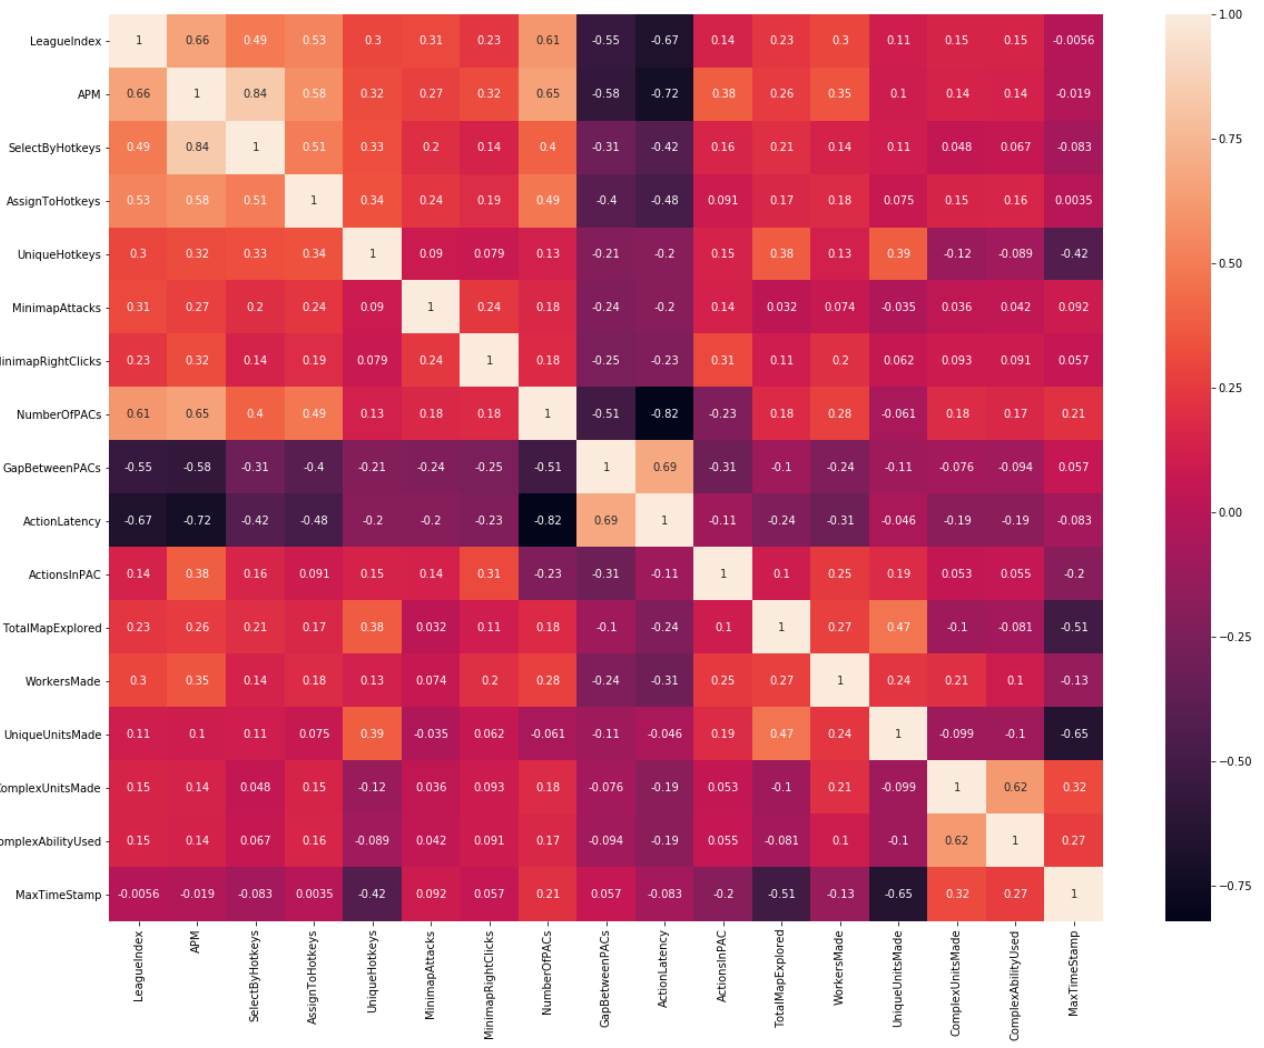
Collinearity was the other issue with the variables. There was a decent amount of it amongst around half of the variables. Like the normality issues these made a good deal of sense. Many variables are naturally related to each other. For instance ComplexUnitCreated and ComplexAbilityUsed are connected because you need to create a complex unit in order to use its ability. To evaluate multicollinearity I started with a covariance heatmap plot to get a general sense of how much collinearity there was in the dataset.
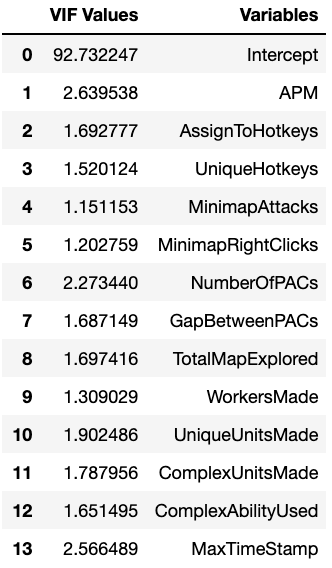
Again I wanted a more rigorous numerical measure of which features were the most problematic in terms of collinearity so I used Variance Inflation Factor (VIF) as the metric. Generally a VIF of > 5 is considered problematic in terms of collinearity so that was my general cutoff. This was the initial result:
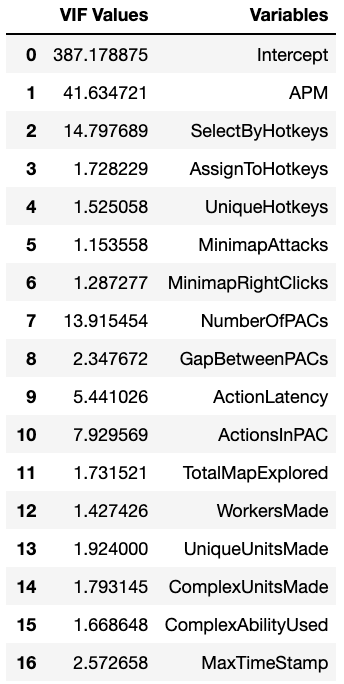
There are several features that are greater than 5 and their relationship to certain other features makes sense, such as ActionsInPAC being related to NumberOfPACs. After eliminating certain features and testing the VIF results I ended up removing 3 of the 5, ActionsInPAC, ActionLatency and SelectByHotkeys, leaving the following:
Checking the covariance heatmap again I saw that a few variables still covaried to a moderate degree. AssignToHotkeys, NumberOfPACs and GapBetweenPACs all covaried with APM and to each other, but were borderline. To maintain the information that they contain, I’ll keep them all, taking into account that they do generate collinearity in the dataset. If they prove problematic later I can remove them.
Ultimately I decided to split the dataset into two versions. One with features for parametric models and another with features for non-parametric models.
Parametric Model Features
Taking both normality and multicollinearity into account
- APM
- NumberOfPACs
- UniqueUnitsMade
Non-Parametric Model Features
Only taking multicollinearity into account
- APM
- AssignToHotkeys
- UniqueHotkeys
- MinimapAttacks
- MinimapRightClicks
- NumberOfPACs
- GapBetweenPACs
- TotalMapExplored
- WorkersMade
- UniqueUnitsMade
- ComplexAbilityUsed
- MaxTimeStamp
4. League Compression
Another decision I made was to compress the League from 8 down to 2 groups of Leagues.
8 Leagues
- Bronze
- Silver
- Gold
- Platinum
- Diamond
- Master
- Grandmaster
- Pro
2 Categories
- Non-Contender (Bronze, Silver, Gold, Platinum, Diamond)
- Contender (Master, Grandmaster, Pro)
I did this for a couple of few reasons. One, was because of the relatively small representation in the upper Leagues. Ideally we would have two categories, Pro and Non-Pro, but there is so little representation in the Pro category (55 out of 3367) that the class imbalance would be too great to be able to effectively classify. Two, these top Leagues are actually the ones we’re most interested. Knowing how the lower Leagues sort out is interesting, but ultimately we want to know who has Pro potential. The level of play at the top Leagues is all very high so knowing who falls into this much larger category is still very valuable.
5. Modeling
- Source Files: /notebooks/
As mentioned above I ended up dividing the modeling into two categories, non-parametric and parametric, with a custom set of variables for each. Because there were many more variables to work with for non-parametric I ended up spending most of my time and effort with those.
I decided on F1 as a primary metric because while I wanted high recall for the Contender level players, I also didn’t want to push the classifier to just put everything in the Contender category. I wanted precision to be good as well and F1 balances both precision and recall. When forced to decide between the two though I’ll err on the side of higher recall to make sure we don’t miss a potential star.
While F1 was the main metric I kept track of precision and recall individually as well, and also evaluated ROC curves, AUC, precision-recall curves and average precision. All of these provide good visibility on how precision and recall are behaving across different models and parameters.
For non-parametric modeling I explored K-Nearest Neighbors, Support Vector Classifiers, and Random Forests as the . I tried many different variations and flavors of these approaches, including simple train/test/split, cross-validation and grid search approaches. The cross-validated approaches got us closer to more reliable scores on test and grid search helped to find optimal hyperparameters.
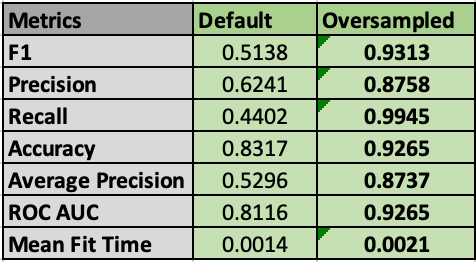
All of these various approaches got incremental improvements, but the thing that made the biggest difference was oversampling, at least in training. Another good side-effect of the compressed Leagues is that it reduced a good deal of the class imbalance, to the point where I thought that it might not matter. However, after using random oversampling to make all classes equal in the training process the scores for all approaches increased a significant degree, at least on training and cross validation. For example ,with KNN using oversampled data led to an increase in F1 score from 0.5138 to 0.9313.
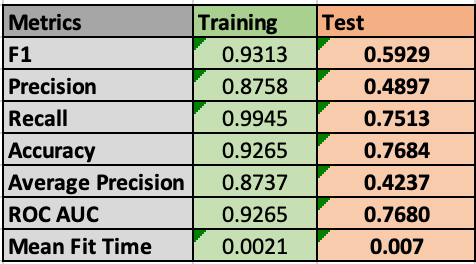
Unfortunately these gains with oversampling on cross validation generally didn’t translate as much to test results. On test with KNN F1 score dropped from 0.9313 to 0.5929. Better than baseline or default algorithm parameters, but a significant drop in performance indicating overfitting during training.
After running all four non-parametric and parametric models the metric results amongst all of the models were roughly similar. There are enough differences to pick one to go with, depending on what our priorities are in terms of recall, precision and execution time. Here are the results. The top performing metric amongst the models is highlighted:
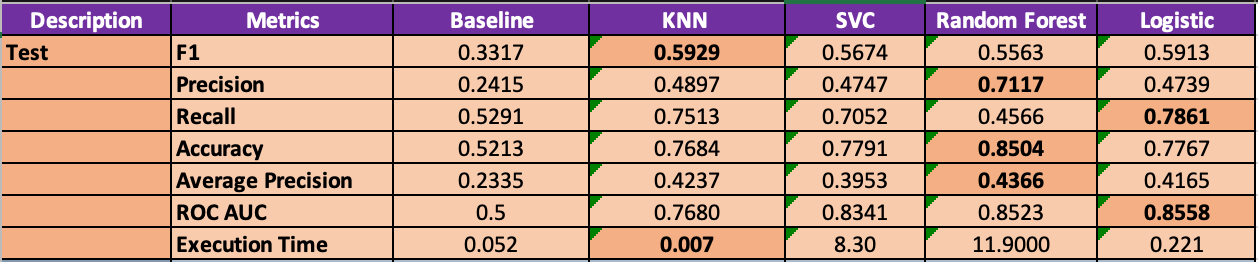
Amongst the models F1 score is pretty close, with KNN being the top performer. As such, the biggest decision is whether to prioritize precision or recall. All of the models tend to favor one or the other, but not perform well on both.
So with our hypothetical StarCraft scout if we assume that the priority to to capture as many potential pro players as possible, even if we get a significant amount of false positives then we will prioritize high recall and choose Logistic or KNN. In this scenario the scout’s organization may have the budget, tools or philosophy to absorb the false positives. It’s also worth noting that these two models have the best execution times as well.
Confusion matrices and metric curves make the tradeoffs a bit clearer than just the metrics, so here are the confusion matrix and precision-recall curve for the Logistic model:
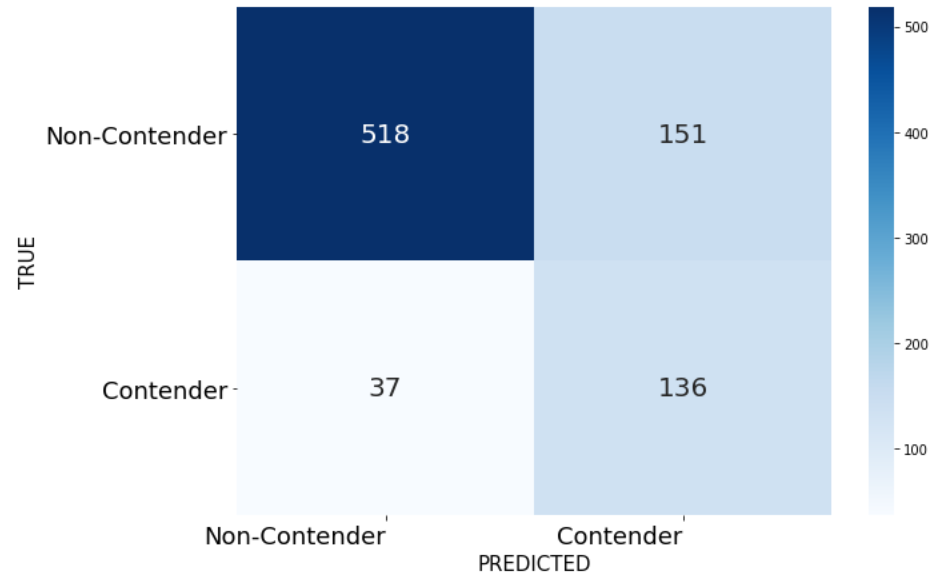
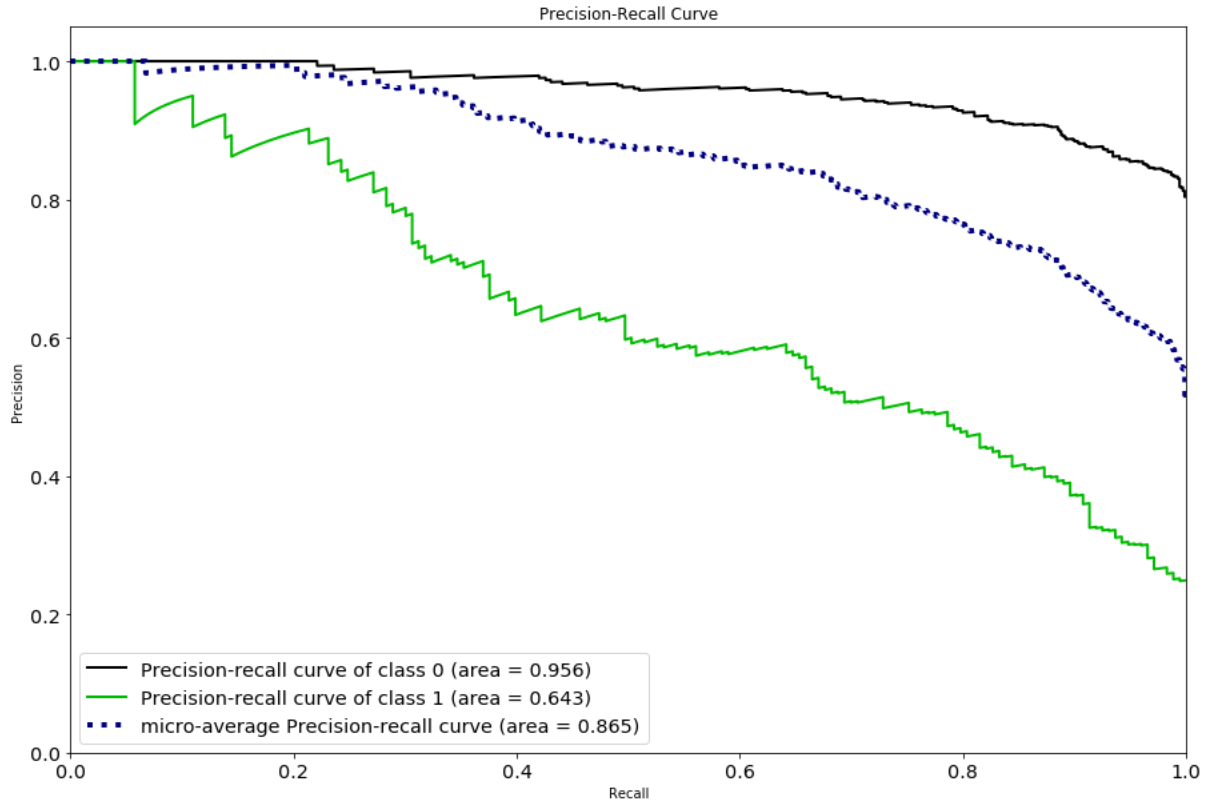
Clearly we can’t have both great precision and great recall with this model. We only miss 37 of the actual Contenders, but the false positives outnumber the true positives.
However, if our priority is to have a higher confidence that players categorized as contenders are actually pro level then we will prioritize high precision and choose Random Forests. In this situation perhaps the organization has a smaller budget and wants to be more sure that the players they’re targeting have actual pro potential. For them it’s much more expensive to deal with a false positive than to miss out on some potential pro players.
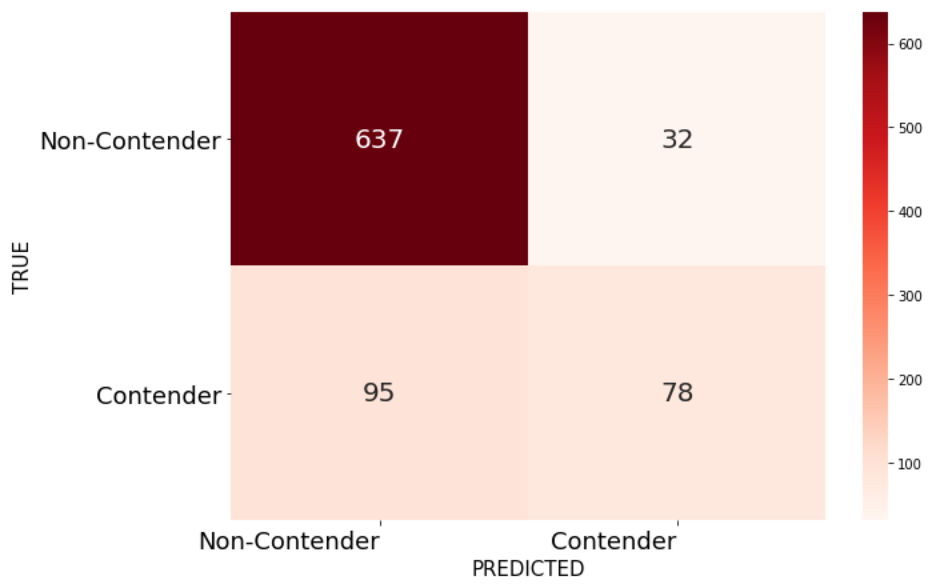
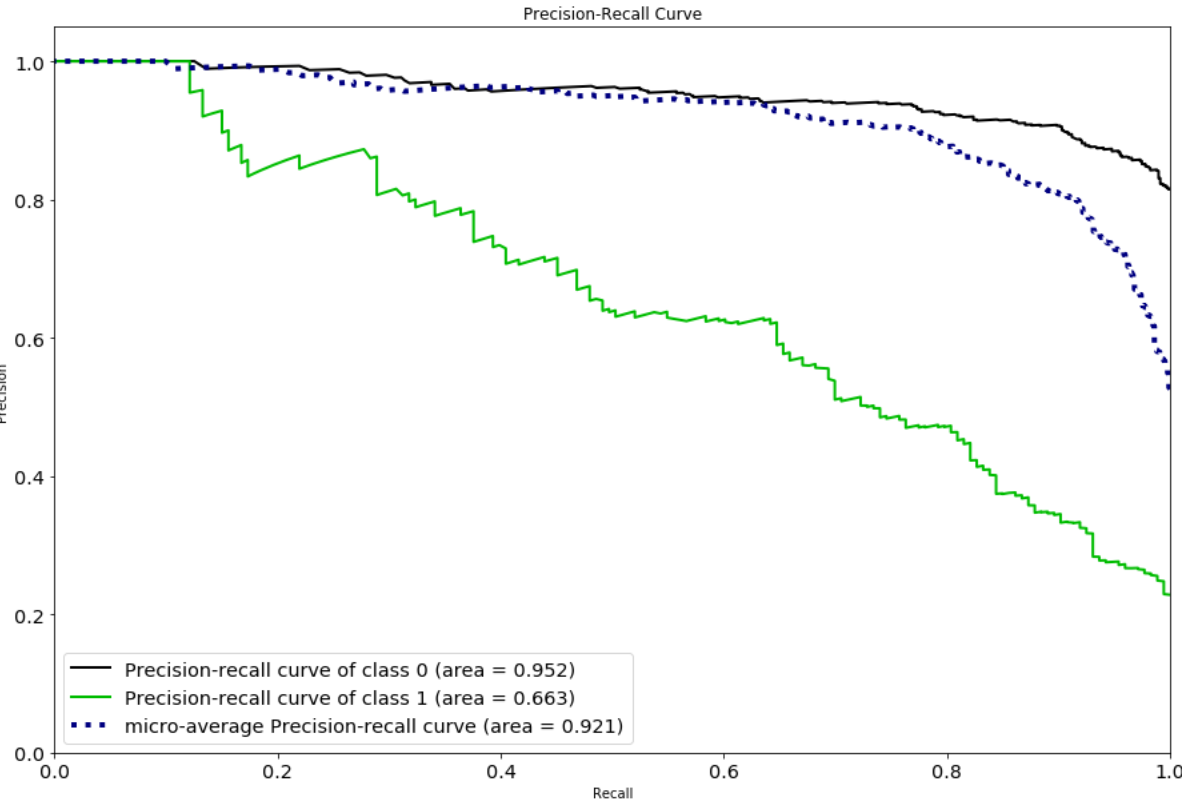
We can see that the amount of true positives outnumber the false positives, but we now have many more false negatives than true positives, with Random Forests.
It’s also worth noting that the execution time of Random Forests was the worst, at ~11 seconds, which is orders of magnitude worse than KNN and Logistic. If performance in a production environment is a concern execution time needs to be taken into account.
Even if we decide not to use Random Forests as our model, it does have another great use, as it provides a feature importance scale, which shows the relative importance of each feature in determining the model.
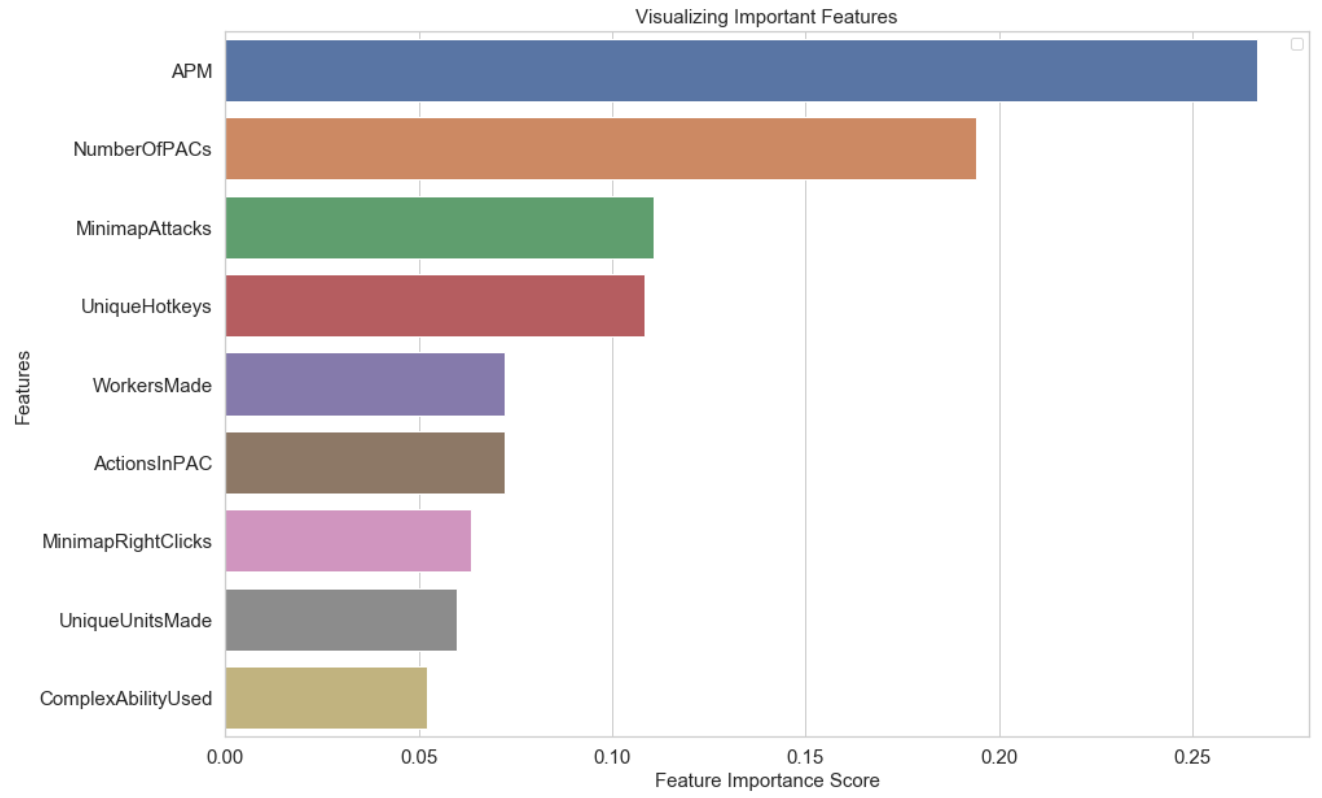
This is very cool to see, but not very surprising. APM is Actions Per Minute, which is at the top of the feature importance list, is essentially how quickly you can input commands in the game. Raw speed of input is not usually a very useful metric for most competitive video games, but StarCraft is a game of intense multitasking and if you can’t do it quickly and accurately you simply won’t perform well, no matter how good your tactical or strategic capabilities are. APM has been used as a high-profile measure of technical skill in StarCraft and other real-time strategy games, and the importance of the feature here reinforces the idea that this is actually a good measure of ability.
6. Future Work
Given more time I would definitely like to investigate parametric approaches more thoroughly. There may be more gains in Logistic Regression or other approaches that don’t sacrifice Accuracy to the degree that it did in my initial explorations. I would also like to attempt to apply these methodologies and insights to other datasets of similar types of variables for other competitive games.
I think there’s definite potential for predictive power with the right variables and metrics and this can be very valuable both for the eSports scene and for game development purposes. Finding automated ways gauge player skill and respond programmatically to optimize the experience would be extremely helpful for making better gaming experiences.
7. Resources
- GitHub Repository - GitHub repository containing all code, notebooks and data.
- Presentation Deck - This is a PowerPoint presentation deck created for a live presentation of project results.
- Modeling Data - Spreadsheet tracking the various algorithms and metrics data generated for the project.